
 Available in US
Content
- What Cricket Odds Actually Tell You About a Match
- The Anatomy of a Cricket Price
- Fractional, Decimal and American Across UK Sportsbooks
- Calculating Returns: Worked Examples in All Three Formats
- How Sportsbooks Build a Cricket Price From Model to Screen
- Why Cricket Prices Drift and Shorten Before First Ball
- How Pricing Tightens From Test to T20 to The Hundred
- The Limits of Bookmaker Precision and Where Mistakes Appear
- Best Odds Guaranteed and Other UK Pricing Conventions
- Pricing Questions Punters Keep Asking
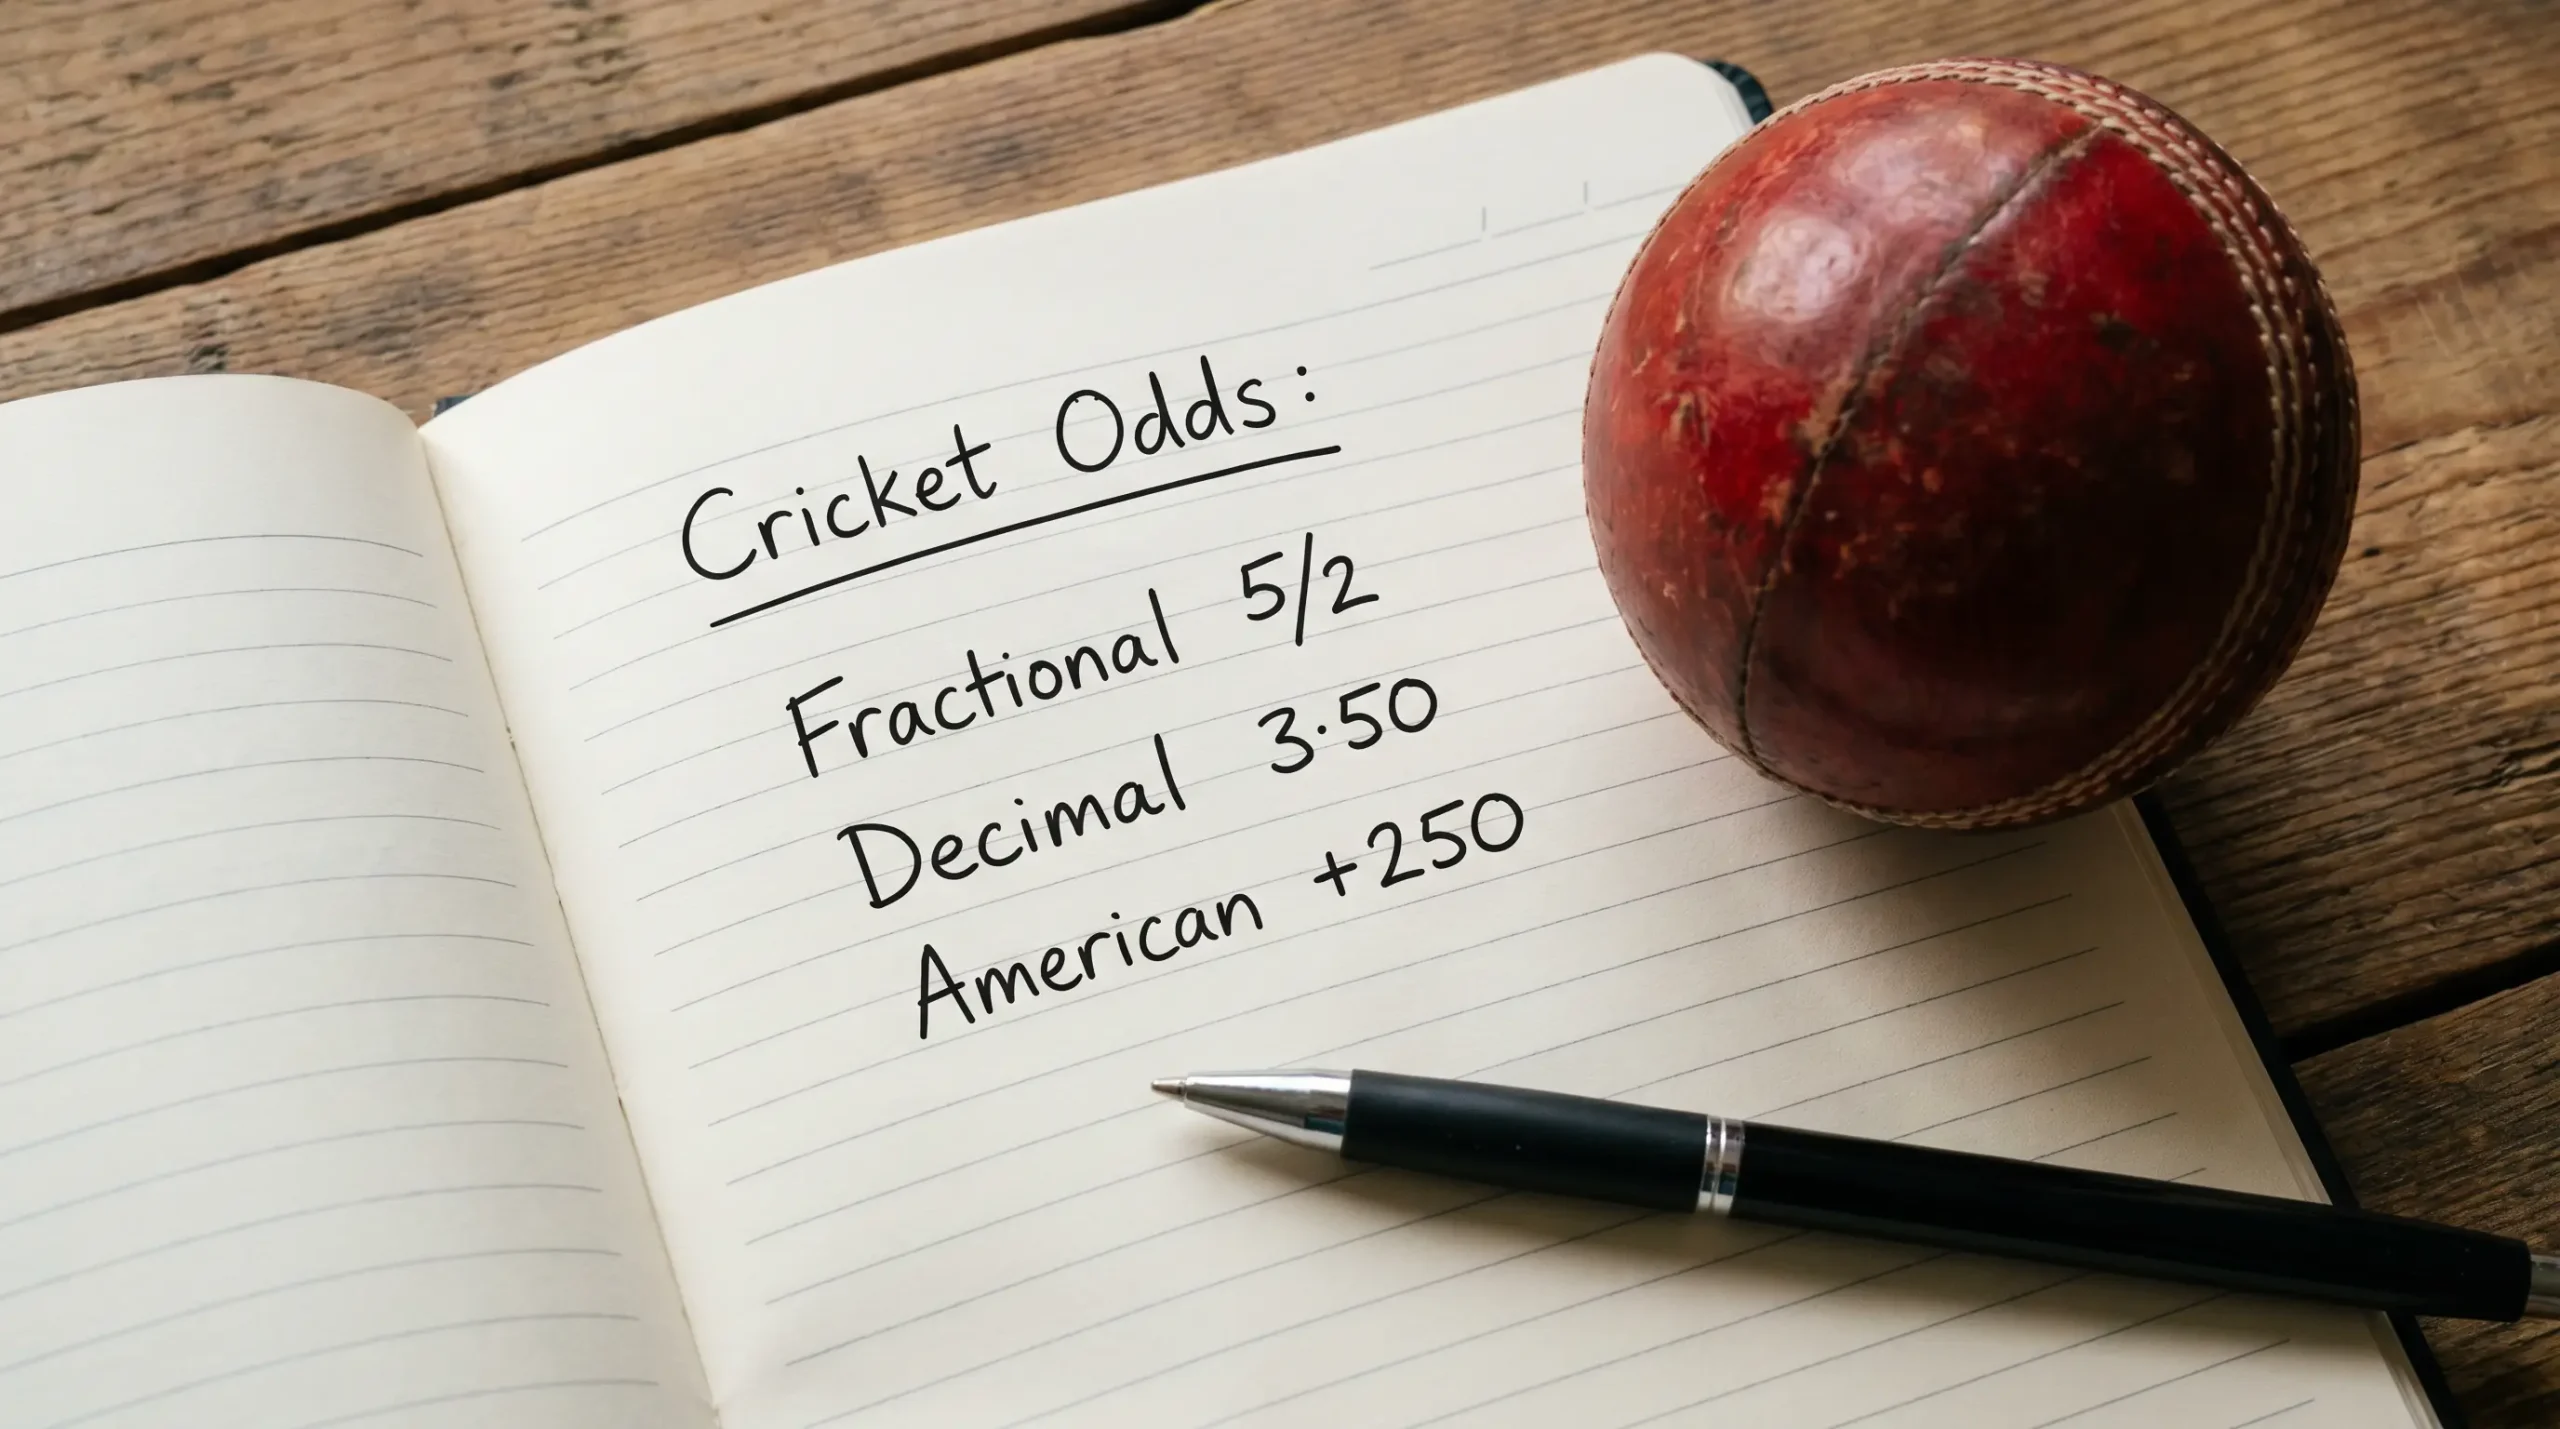
What Cricket Odds Actually Tell You About a Match
An England Test win priced at 8/11 sounds like a confident book. Decode it and you find an implied probability close to 58 percent — before you strip out the operator’s margin. That gap between what the price looks like and what the price actually means is the entire game.
Every cricket odd is a compressed package of three things. The first is the operator’s modelled view of true probability, which comes from historical data, current form, conditions, and a thousand smaller inputs. The second is the operator’s commercial margin, which determines what the line on screen looks like compared with the line a fair coin-toss bookkeeper would have offered. The third is the operator’s risk position — what their book already holds in liabilities — which can shade a price tighter or looser than the model alone would justify.
I have spent nine years pulling these three layers apart for a living. The first layer is what most punters think they are reading. The second is what operators publish in their odds checker. The third is invisible to almost everyone outside the trading floor, and it explains why the same match can carry materially different prices across UK sportsbooks twenty minutes apart.
The UK is, for what it is worth, a market where this kind of decomposition is worth the work. Online accounts for 78.47 percent of British sports betting revenue, which means the prices you see on screen are the prices that matter. Retail counters quote the same numbers because they have to compete with the screen. Get the maths right and the price you click is a price you can attack. Get it wrong and the price is just a number you stared at while losing money.
The Anatomy of a Cricket Price
Take 1.80 in decimal. Convert it. The implied probability is 1 divided by 1.80, which is 55.56 percent. Now do the same with the other side of the same two-way book, say 2.10. That gives 47.62 percent. Add them. You get 103.18 percent. That extra 3.18 percent is the operator’s margin, the overround, the place where the bookmaker pays his rent.
This is the first piece of arithmetic every cricket punter should be able to do on a phone screen without thinking. The overround is the single most important number on the coupon, and it is the one most punters never calculate. A two-way market with a 2 percent overround is a tight book, the kind UK operators publish on headline Indian Premier League fixtures where competitive pressure forces margins low. A two-way market with a 7 percent overround is a thin book on a market the operator does not really want to run. A three-way Test match book with a 6 percent overround is typical; a three-way book with a 12 percent overround is a venue you should not bet at.
Three-way books — home win, draw, away win in Test cricket — change the arithmetic only slightly. Convert all three prices to implied probability, add them, and the excess over 100 percent is the overround. If England are 2.10, the draw is 2.50, and Australia is 3.40, you get 47.62 plus 40.00 plus 29.41, totalling 117.03 percent. That is a 17 percent overround, which is high for a Test market and tells you the operator is either not confident in the model or not interested in attracting heavy action.
Once you can read overrounds you can do the second calculation, which is true probability. Take each side’s implied probability and divide by the sum of all implied probabilities. England at 47.62 / 117.03 gives a true probability of 40.69 percent. That is the operator’s actual estimate before the margin is layered on. If your own model says England’s true probability is 45 percent, you have value at that price. If your model says 38 percent, you do not.
Fractional, Decimal and American Across UK Sportsbooks
British sportsbooks have a tradition problem. The country invented modern bookmaking on the racetrack with fractional odds — 5/2, 7/4, 6/4 — and the convention survives even though every operator’s pricing engine works in decimal underneath the hood. Then American odds appeared on screen for the punters watching the cricket on a US-licensed platform, and now most coupons offer all three side by side.
Fractional odds quote the profit relative to the stake. A horse — or a cricketer — at 5/2 returns five units of profit for every two units staked, on top of the returned stake. That is a total return of 7 units on a 2-unit stake, or 3.50 in decimal. The conversion is direct: take the fraction, add 1, and you have decimal. 5/2 plus 1 equals 3.50. 11/10 plus 1 equals 2.10. 1/2 plus 1 equals 1.50.
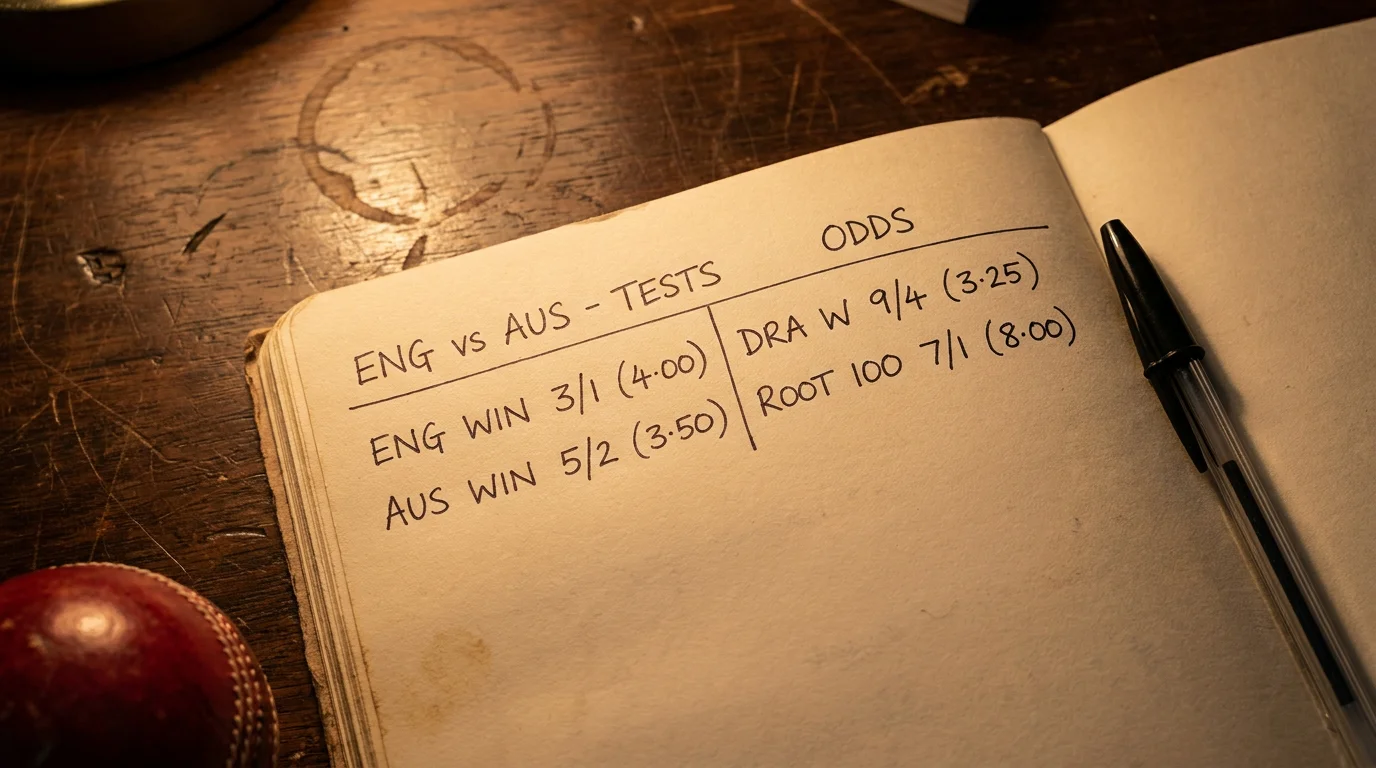
Decimal odds quote the total return per unit staked, including the returned stake. A price of 2.10 returns 2.10 units for every 1 unit staked, so the profit is 1.10 units. Decimal odds make payout calculation trivial — multiply stake by price — and they make probability calculation trivial — divide one by the price. This is why every modern pricing engine runs in decimal even when the screen displays fractional.
American odds quote either the profit on a 100-unit stake (for prices longer than evens) or the stake needed to win 100 units (for prices shorter than evens). A team at +210 in American returns 210 units of profit on a 100-unit stake, which equals 3.10 in decimal. A team at -150 requires a 150-unit stake to win 100 units, which equals 1.67 in decimal. The format is foreign to UK punters but appears on UK sportsbooks that licence to a global audience.
For cricket specifically, the format question matters because most UK coupons quote fractional for outright and main markets — match winner, top batter, top bowler, series winner — and decimal for everything else, including in-play and most prop markets. The cleanest workflow is to read fractional for the main book, mentally convert to decimal for the calculation, and trust that the underlying engine is consistent across formats. If you see a discrepancy across formats on the same selection — fractional showing 11/10 and decimal showing 2.05 instead of 2.10 — it is almost always a display rounding artefact, not a pricing arbitrage opportunity.
One subtle UK convention: fractional odds on a heavy favourite are usually quoted as “on” odds, meaning the stake exceeds the profit. A team at 1/2 returns half a unit of profit for every unit staked — decimal 1.50. The “on” phrasing — “England are 1/2 on to win” — does not appear on the coupon itself but appears in editorial and broadcast commentary, and it can confuse newcomers. Treat it as a verbal shorthand for “odds of 1/2”, nothing more.
Calculating Returns: Worked Examples in All Three Formats
A reader once sent me a message claiming his sportsbook had short-paid a winning bet. He had staked £25 at 5/2, received £62.50, and was convinced he was owed more. He was not. The maths is worth walking through because his confusion is everyone’s confusion the first time.
At 5/2 fractional, his stake of £25 returns profit of £25 multiplied by 5 divided by 2, which is £62.50, plus the returned stake of £25. Total payout: £87.50. He had received the profit, not the total payout, which was the source of the confusion. In decimal, the calculation is even quicker: £25 multiplied by 3.50 (which is 5/2 plus 1) equals £87.50. The total payout includes the stake.
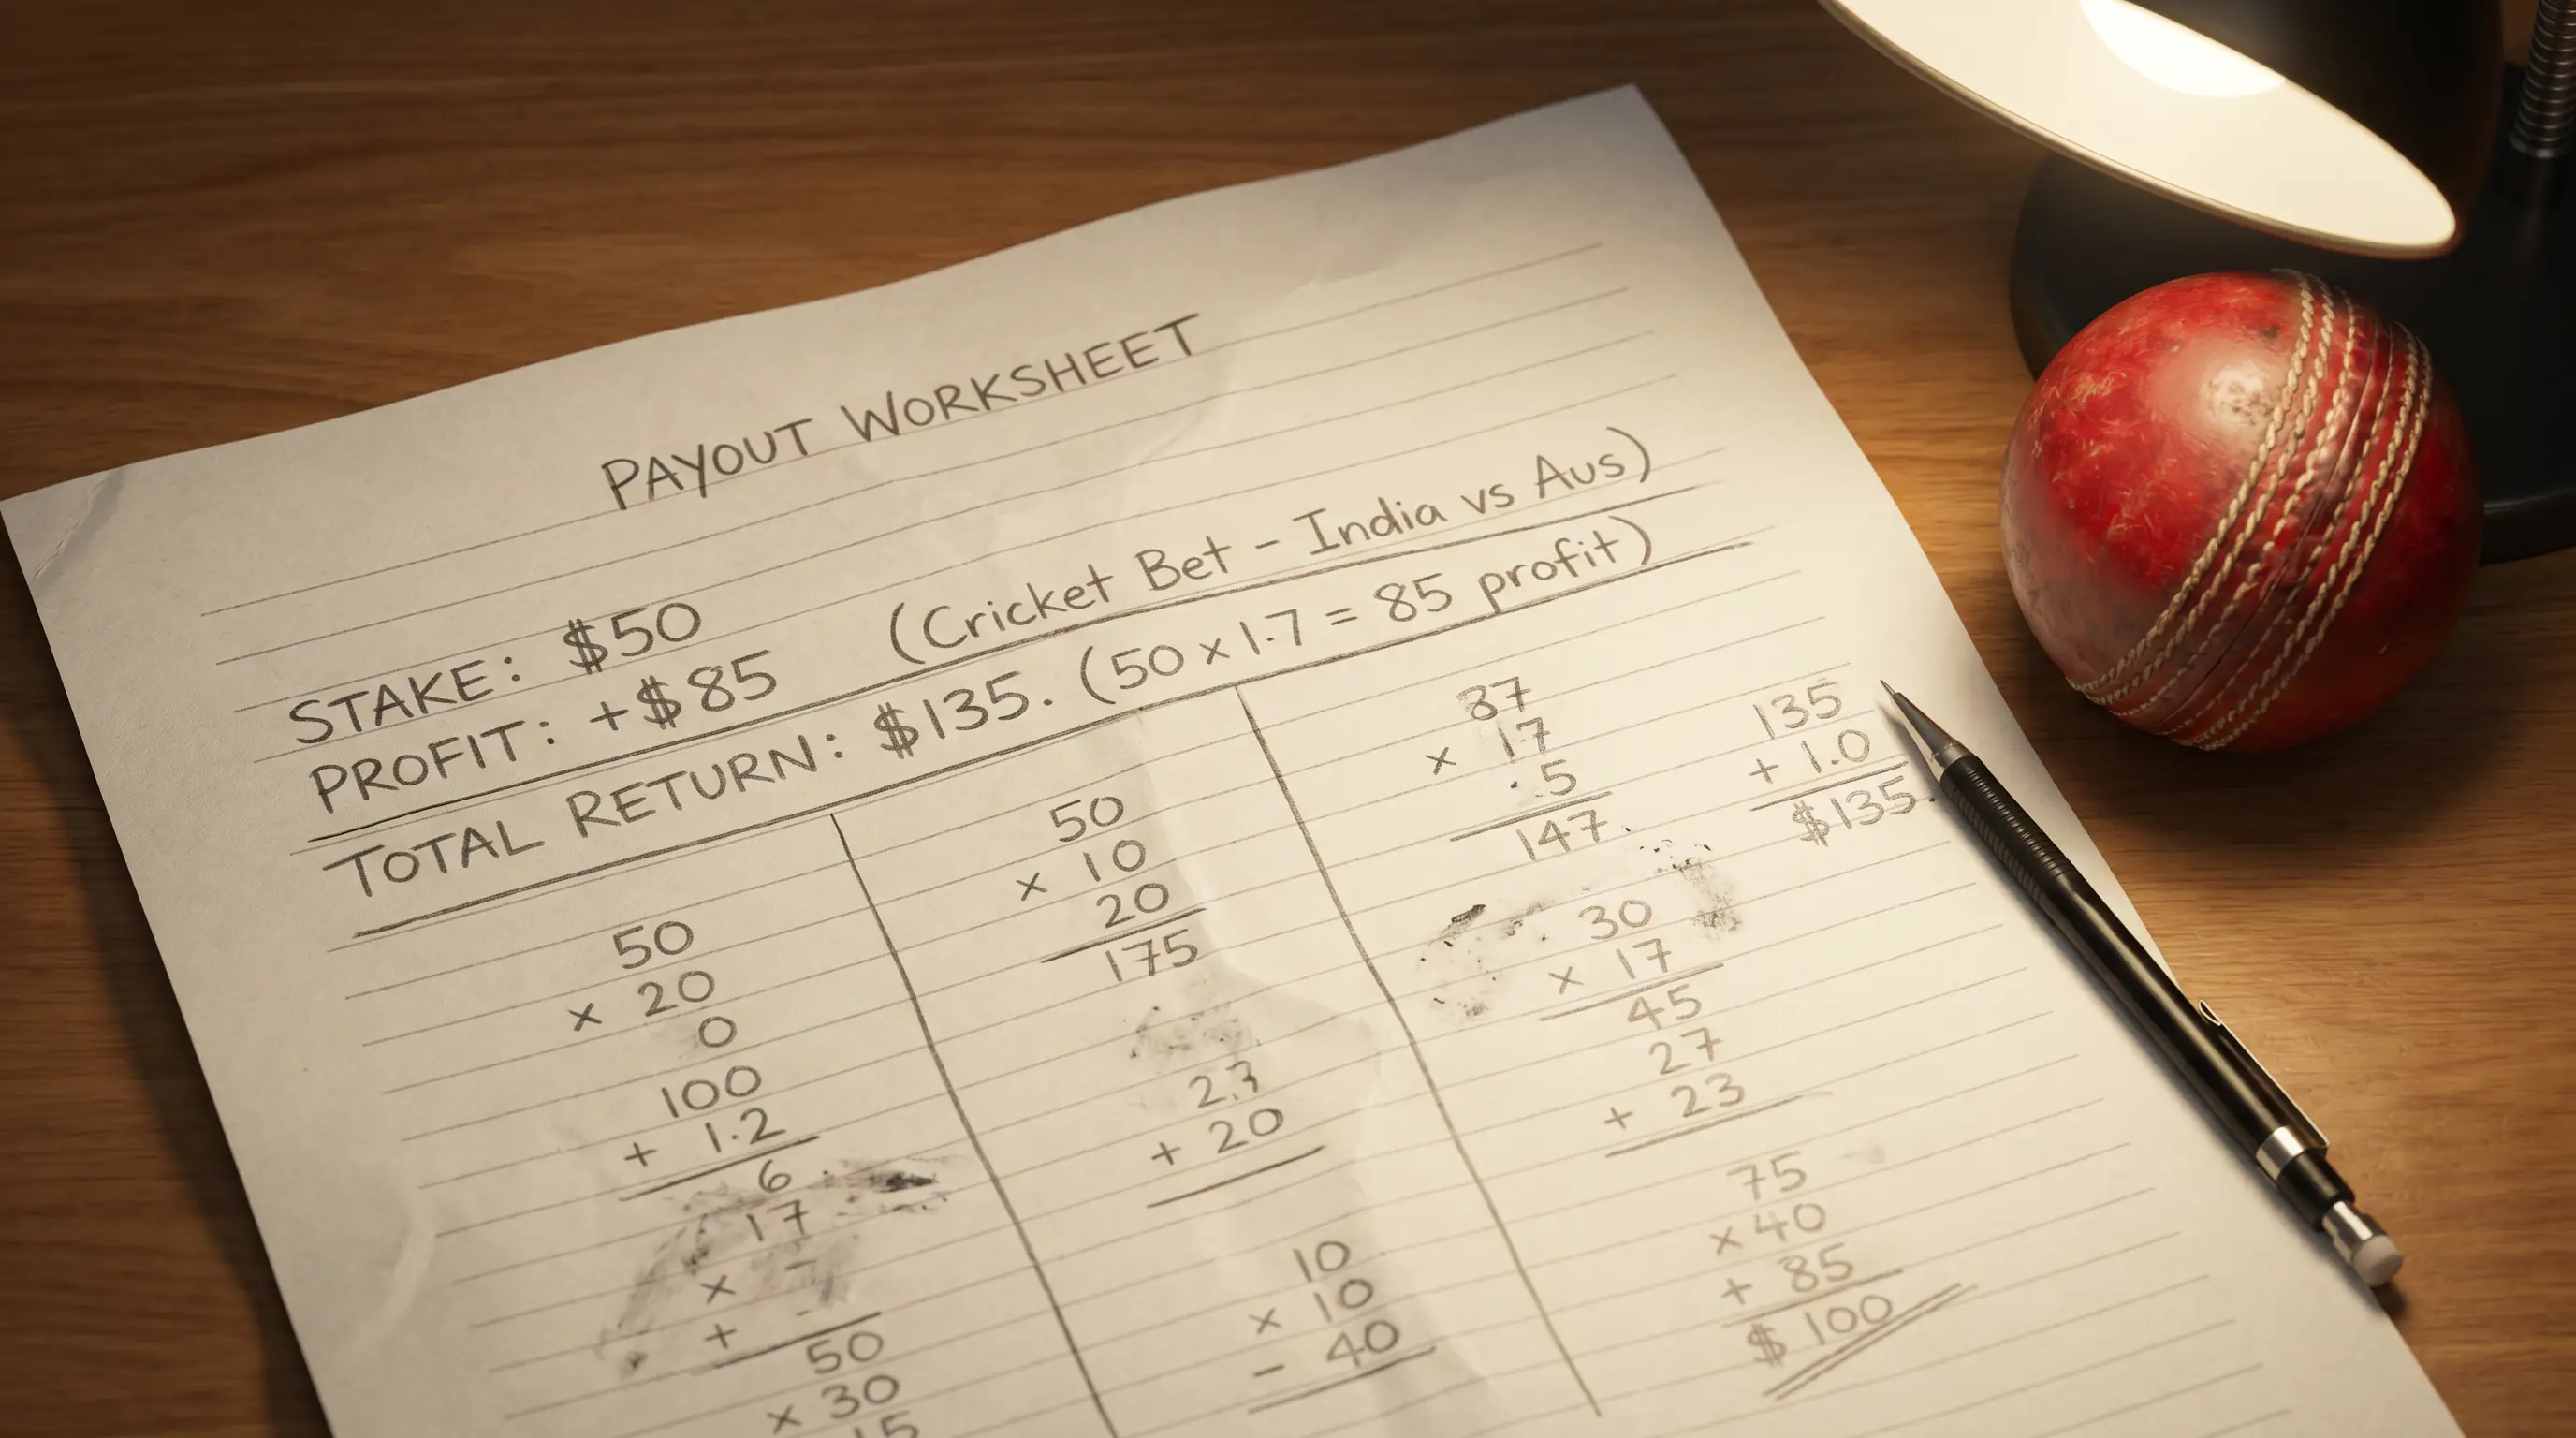
Take a slightly trickier example. Bangladesh are 9/4 to beat Sri Lanka in a T20I. You stake £40. Profit is £40 multiplied by 9 divided by 4, which is £90. Total payout £130. In decimal — 9/4 plus 1 equals 3.25 — your stake of £40 multiplied by 3.25 returns £130. Same answer, faster arithmetic.
Now an “on” example. England are 4/7 against Ireland in an ODI. You stake £35. Profit is £35 multiplied by 4 divided by 7, which is £20. Total payout £55. In decimal, 4/7 plus 1 equals 1.571, and £35 multiplied by 1.571 equals £55.
American odds: India are -180 favourites against the West Indies in a T20I. You stake £90 — the convention requires the stake to be the larger number on the favourite side, scaled. Your profit is £90 multiplied by 100 divided by 180, which is £50. Total payout £140. The reverse case: the West Indies are +160. You stake £25. Profit is £25 multiplied by 160 divided by 100, which is £40. Total payout £65.
Each-way and place markets occasionally appear on cricket outright competitions. A team backed each-way for the World Cup outright pays half the win price for a place finish — typically top two or top four depending on the operator’s terms. If the team is 14/1 each-way with a one-quarter place fraction over the top two, a £10 stake breaks into £10 for the win and £10 for the place. The win leg pays £150 on a 14/1 winner. The place leg pays £45 — 14 divided by 4 equals 3.5, times £10 stake equals £35 profit, plus the £10 stake equals £45. Total payout on a winner is £195.
How Sportsbooks Build a Cricket Price From Model to Screen
The pricing floor at a UK sportsbook on the morning of an India versus Pakistan match is not a single trader staring at a spreadsheet. It is a model running thousands of simulations against a database of historical fixtures, current form indices, weather forecasts, pitch profiles, and the operator’s own liability book. The trader’s job is to sanity-check the output and decide which markets to publish and at what margin.
The model itself is built from several layers. Historical match data feeds a base probability for each outcome. Current form weights adjust those base probabilities for recent results, with a half-life that fades older results out of relevance. Conditions data — pitch report, weather, ground, dew estimates — applies a venue-specific overlay. Player availability, lineups, and known injuries layer on top. The combined output is a true probability for each outcome on each market the operator runs.

Margin is the second layer. The operator decides what margin to apply based on the market’s liquidity, competitive pressure from other UK books, and the operator’s appetite for that market. Tight markets — headline international match winners — carry margins as low as 2 to 4 percent. Thin markets — exotic specials, minor league matches — carry margins of 10 percent or more. The margin is the wedge between the model’s true probability and the price displayed on screen.
The third layer is the operator’s risk position. If the book is heavily one-sided — say, half the staked money sits on India to win — the operator shortens India’s price to discourage further action and lengthens Pakistan’s price to attract balancing bets. This is liability management, not modelling. The price on screen at any moment is a blend of the model’s view and the book’s current liabilities.
Integrity surveillance now sits inside the same machine. Sportradar’s Universal Fraud Detection System flagged 56 percent more suspicious matches in 2025 than in 2024 — the count rose from 436 to 682 — and the same machine-learning architecture that detects suspicious betting patterns increasingly informs the price-building model itself. Pricing and integrity are no longer separate functions; they are different views of the same data layer. As Sportradar’s Andreas Krannich put it, the notable reduction in suspicious matches in 2024 gave reasons to be optimistic, but it also signalled the need for continued vigilance and innovation given that the number remained significant. That sentiment now shapes how pricing engines treat unusual money flows on cricket — caution is the default response, not adjustment.
What this means for the reader is direct. The price on screen is not a single trader’s guess. It is the output of a layered industrial system, and the system is honest enough on liquid markets that finding edge is rare. The way to find edge is to understand a layer — usually conditions, lineups, or in-play state — better than the model does, and to act before the model’s slower data feeds catch up. That is the entire premise of value betting in cricket, and it is a much narrower premise than most beginner guides suggest.
Why Cricket Prices Drift and Shorten Before First Ball
I keep a price log on every match I cover. The pattern is identical across formats. The opening price the night before the match is the operator’s first honest stab at the true line. By the morning it has moved, sometimes substantially. By the toss it has moved again. By the first ball the price is its tightest, and from that moment until the first wicket falls, it barely moves at all.
The drift between opening and first ball reflects information arrival and money flow. Lineups are confirmed roughly an hour before the toss. Pitch reports become more specific as the umpires walk out. Weather radars sharpen. Each new piece of information is folded into the model, and the price adjusts. At the same time, the operator’s book begins to fill with stakes, and liability management kicks in. The combined effect is a price that drifts in the direction of whichever team the market is backing.
Shortening is not the same as movement towards true probability. A favourite shortening from 1.85 to 1.70 may reflect new information — a key bowler missing for the opposition — or it may reflect heavy money on the favourite that has pushed the book out of balance. The two cases look identical on screen and they require different responses. If the shortening is information-driven, the new price is the better price. If it is flow-driven, the old price was more accurate and the value has now disappeared from the favourite.
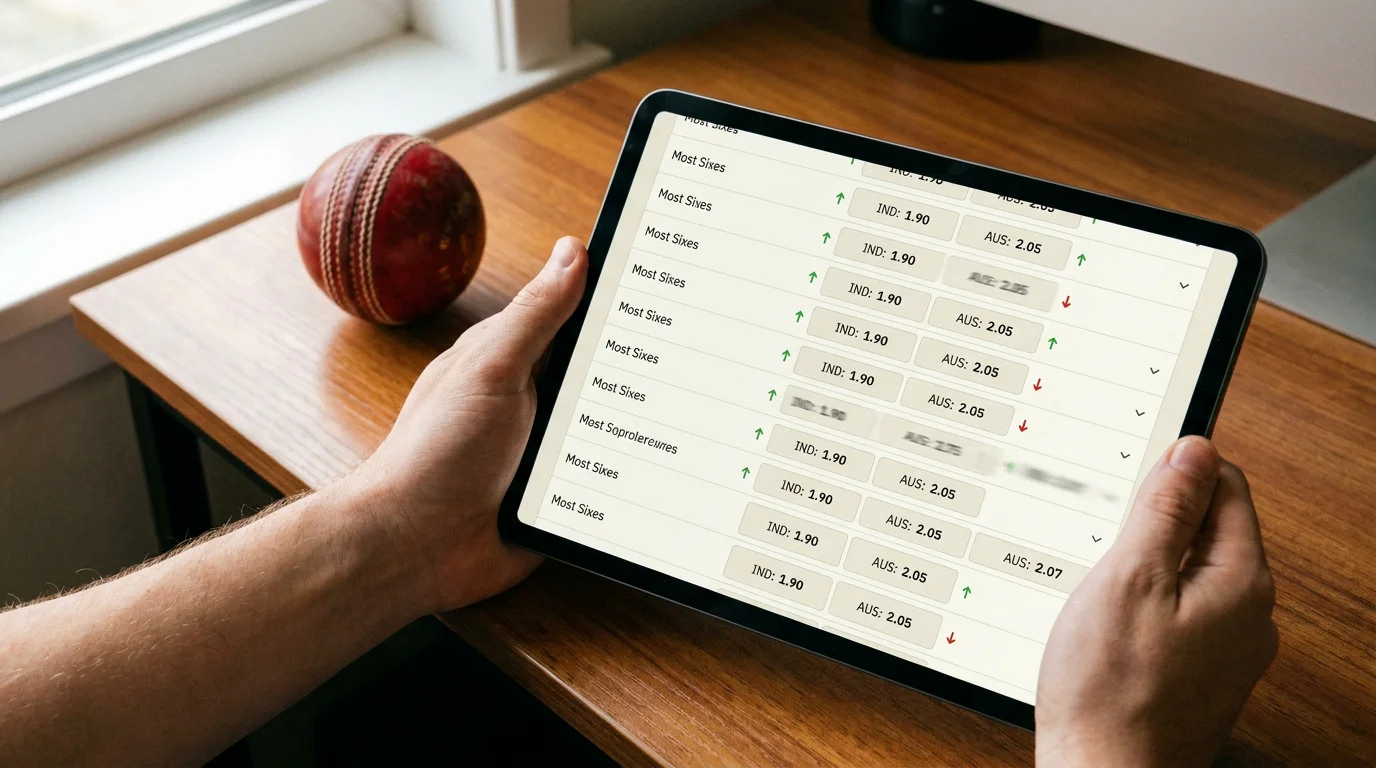
Distinguishing the two requires watching multiple operators. If three UK books all shorten the favourite at the same time, the move is information-driven and the new price is likely the better estimate. If one operator shortens hard while the others stay still, the move is flow-driven on that operator’s book, and the better prices remain on the books that have not moved.
The other movement pattern to know is the pre-toss “draw drift” in Test cricket. The draw price usually shortens overnight on day one as overnight rain becomes a possibility and as the model updates its weather inputs. Punters who back the draw value will often see their price erode between bedtime and breakfast. The same pattern reverses on the morning of a sunny day five, when the draw lengthens because conditions favour a result.
How Pricing Tightens From Test to T20 to The Hundred
The shorter the format, the tighter the operator’s pricing tolerance. That is not a marketing claim. It falls out of variance maths and broadcast economics.
Test cricket pricing accommodates wide uncertainty bands because the match runs for five days, conditions evolve, and the outcome distribution is broad. A Test match winner book can sit at 6 to 8 percent overround comfortably because the underlying variance justifies the cushion. ODI pricing tightens to roughly 4 to 6 percent because the format compresses the variance and the book can be more confident about outcomes once the toss and the first powerplay have been observed.
T20 pricing tightens further, to 3 to 5 percent on headline matches, because the format itself constrains the outcome distribution. There are only twenty overs per side. The model has clean reference data, the variance is bounded, and the operator can publish a sharper price without taking unreasonable risk. The Hundred goes one step further — only one hundred balls per side — and the model’s confidence interval narrows again.
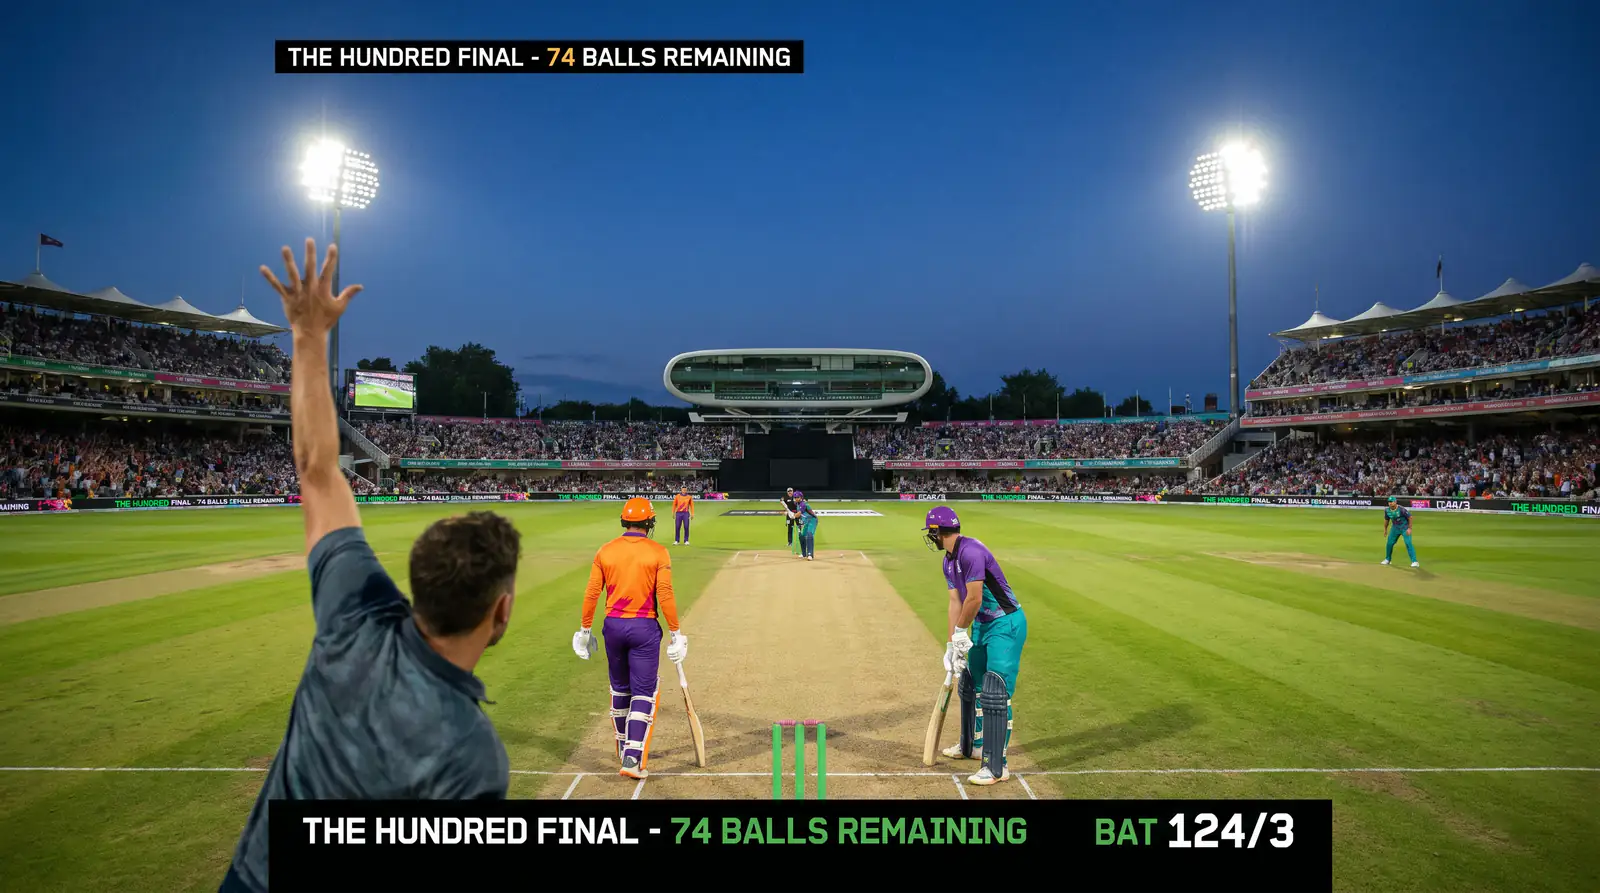
The Hundred final in 2025 pulled more than 1.3 million live viewers on the BBC App alone, which materially affected market depth and tightened margins on the operators’ coupons. The pattern is consistent: where audience and turnover are high, margins compress, prices sharpen, and the punter sees the tightest book of the cricket calendar. Where audience is thin — County Championship four-day cricket, lower-tier T20 — margins expand and prices loosen.
The practical takeaway is simple. If you are looking for the lowest-friction environment in which to back cricket, headline Hundred and IPL fixtures on a top UK operator are it. Margins are tight, prices update fast, liability management is aggressive but balanced, and the gap between true probability and quoted probability is at its narrowest. Test cricket carries more potential edge for a sharp punter who understands conditions, but it is a slower game with wider margins, and the trade-off should be deliberate.
The Limits of Bookmaker Precision and Where Mistakes Appear
Sportsbooks are good. They are not infallible. With roughly 290 million online sports bets placed across UK operators each month, the pricing engine cannot afford individual errors at scale — the volume itself enforces accuracy. But the engine still produces mistakes in three specific places: edge markets, transition moments, and information lags.
Edge markets are exotic specials and milestone props where the underlying model is leaning on small samples. A “first wicket method” market on a fixture between two unfamiliar sides may be priced from a generic distribution rather than a venue-specific or matchup-specific model, and the resulting price can be materially wrong. The catch is that these markets carry wide margins, so even when the model is wrong, the margin often eats the edge.
Transition moments are the seconds and minutes around major events — a wicket, the powerplay ending, the start of an innings break, the resumption after rain. Pricing engines need a brief window to integrate the event into the model and reprice all dependent markets. During that window, prices can lag the real situation, and a punter watching live can occasionally find a price that has not caught up with what just happened on the field. Operators counter this by suspending markets briefly around major events, but suspensions are inconsistent across books.
Information lags are the third category. The model’s data feeds come from match-data providers, weather services, and pitch reports. If any of those feeds is slow — a delayed lineup confirmation, a stale weather radar — the model’s view of the match is older than the public information available to a sharp punter. The window is usually minutes, sometimes longer if a key piece of news breaks shortly before the toss.
Sharp punters live in these three places. The mistake casual punters make is assuming sharp betting means knowing something the operator does not. It rarely does. Sharp betting means acting on public information faster than the operator’s data feeds, or recognising a small-sample pricing error in an exotic market, or pouncing on a transition lag. The edge is procedural, not informational, and it is much narrower than beginner content suggests. I want readers to understand this because it shapes how they should stake.
Best Odds Guaranteed and Other UK Pricing Conventions
UK sportsbooks do not compete only on price. They compete on price guarantees, which are conventions that effectively widen the price you get in exchange for a marketing hook. Best Odds Guaranteed — BOG — is the largest of these conventions in cricket markets.
The standard BOG offer applies to most outright and match-result markets on televised cricket. If you back a selection at one price and the official starting price (SP) at the toss is longer, the operator pays you at the longer price. The downside protection is one-way: if the price shortens before the toss, you receive the price you took. The economic value of BOG depends on how often the operator’s prices drift longer between bet placement and the toss. On heavily traded markets, drift is rare. On less liquid markets, drift can be material, and BOG meaningfully improves the expected return on the stake.

Acca insurance is a second convention. If a five-leg cricket accumulator loses by one leg, the operator refunds the stake in free bets up to a cap. The terms vary substantially: some operators apply it only to acca with three or more legs, some require all legs at odds of at least 1.50, some cap the refund at £25, others go higher. Read the small print before relying on it.
Price boosts are a third convention. The operator publishes an enhanced price on a selection, usually a same-game player prop or a low-probability special. Boosts are real and the operator does take a loss on them — they are explicit marketing spend — but the typical structure boosts a price that already carried high margin in the standard book, so the boosted price is not always better value than a standard price on a tighter market.
The convention to ignore in cricket is the “first scorer money back” type offers familiar from football, which adapt poorly to cricket. Some books run “first wicket money back if your team is bowled out for under 100” style offers, and they are economically thin because the trigger event is rare and the refund is in free bets, not cash. They are entertainment, not value.
Pricing Questions Punters Keep Asking
The four questions below are the ones I get most often after my readers have worked through a worked example or two. They tend to arrive in the same order, which is why I keep them together.
Why does the same match show different prices across UK sportsbooks?
Different operators run different pricing models, different margin structures, and different liability positions. A match between India and Australia might be priced at 1.85 / 2.05 on one book and 1.80 / 2.10 on another, even though both are licensed in the UK and both have access to the same public information. The difference reflects the operator’s appetite for the market and the current state of their book. Compare prices across at least three books before placing meaningful stakes.
Can decimal and fractional odds give different actual returns?
No, but rounding can make them appear to differ. A price of 11/10 in fractional converts to exactly 2.10 in decimal. If the same selection is displayed as 11/10 and 2.05, it is a display rounding artefact rather than a real pricing difference. The underlying pricing engine works in decimal, and the fractional display is converted from that. If you stake on the fractional display and your slip settles in decimal, the engine uses the decimal value of the fractional you saw, so there is no actual return difference.
How fast do cricket prices update during a live innings?
Live cricket prices update typically every ball, with brief suspensions around major events — wickets, boundary fours and sixes, end of overs, end of innings. The latency between the on-field event and the price update is usually 5 to 15 seconds, depending on the operator’s data feed quality. Television and stream feeds carry their own delay, so the price you see may already reflect an event that you have not yet seen on screen. Trade against your stream, not against the live price.
Does ‘odds against’ ever apply to a heavy favourite in cricket?
Rarely. ‘Odds against’ means the price is longer than evens — fractional 6/4 or 9/4, decimal above 2.00 — and applies to selections estimated at less than 50 percent probability. A heavy favourite, by definition, is priced at less than evens, which is ‘odds on’. The only place a heavy favourite carries odds against in cricket is in a three-way Test book where the draw absorbs probability and pushes both the home and away win prices longer than evens. Outside that specific case, a favourite is always odds-on.
